State Finance
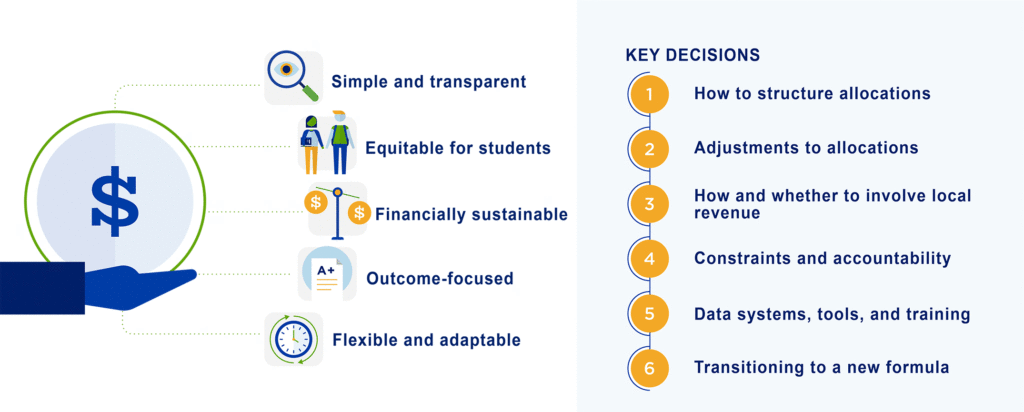
Desired features of a State Funding System

We created this decision tree to help policy makers review and design state education funding formulas. It describes the desired features of a state education funding formula and walks policymakers through key decisions and considerations around balancing allocation and trade-offs in particular contexts.
Please email any questions to us at edunomics@georgetown.edu.
States provide the biggest share of funding for public education in the United States. This grants state education finance policy an outsized impact on districts, schools and students. We analyze pressing state issues, from skyrocketing pension debt (and how states might combat it) to shifting models for allocating resources to districts (and the tradeoffs implicit in those shifts).
One of a state’s primary responsibilities is to divvy up the public funds for K-12 schooling. A set of finance policies determines how the state and local funds are apportioned—and what is expected in return—so that districts and other providers can then apply them to schools and classrooms. While each state formula varies, there are desired features and key decisions for consideration.
Spending vs. Outcomes by School
Interactive data displays allow users to explore how dollars are allocated to schools, and which schools are most able to leverage their money to maximize student outcomes. Click any state to explore and filter by specific districts, school characteristics, and student demographics. Darkest blue states use FY23 fiscal data; medium blue states use FY22; lighter blue states use FY21.
Spending data per student for each school is shown on the horizontal axis. The vertical axis displays outcomes; the source is noted in the axis label. Note at what value the axis starts (this is often>zero).
Our team is making regular updates. If you have questions or would like to be notified when your state is updated, please email us at edunomics@georgetown.edu.
We suggest using Chrome for best access to scatterplots in Tableau.
Financial Decision-Making Working Group (FIDWIG) Meetings
FiDWiG is a collaboration between state education agencies (SEAs) led by Edunomics Lab on how to leverage financial transparency for data-driven decision-making. FiDWiG created a set of voluntary, minimal reporting criteria, the Interstate Financial Reporting, to ensure per-pupil expenditure measures have common meaning across states.
Please contact us at edunomics@georgetown.edu for accessible versions of the meeting resources.
Related Resources
- Webinars & Presentations
- Nov 20, 2025
30-Min Webinar: Must budget cuts erode district quality?
In this 30 minute webinar, Marguerite shares a range of options for how districts can spend smarter toward building long-term financial health and growing outcomes for students. And which districts are doing this well.
- Newsletters
- Oct 28, 2025
Schools need Title I. Kids need it to work better.
Each year the federal Title 1 program delivers $18B to districts, and in return districts are supposed to close achievement gaps between students from low-income households and their peers. With missed results and proposed cuts now might be a good time to recommit to the deal and make measurable progress for low-income students.
- Newsletters
- Jul 15, 2025
An ed finance gamechanger has arrived: It’s not what you think
There's a lot of attention on the July 1 federal withholding of some Title funds however the real ed finance game changer is OBBBA's tax credit scholarship provision.There are still a lot of details to be hammered out but It’s the type of money that changes the education landscape over time.
- Articles & Publications
- Sep 13, 2024
A Financial Analysis of Public Funds Invested via ESAs, Vouchers and Tax Scholarships
This real-time financial analysis tracks state funding going into private options, to quantify how many public dollars are flowing through ESAs, vouchers, and tax credit scholarships. FY23-24 and FY 24-25 analyses available.

