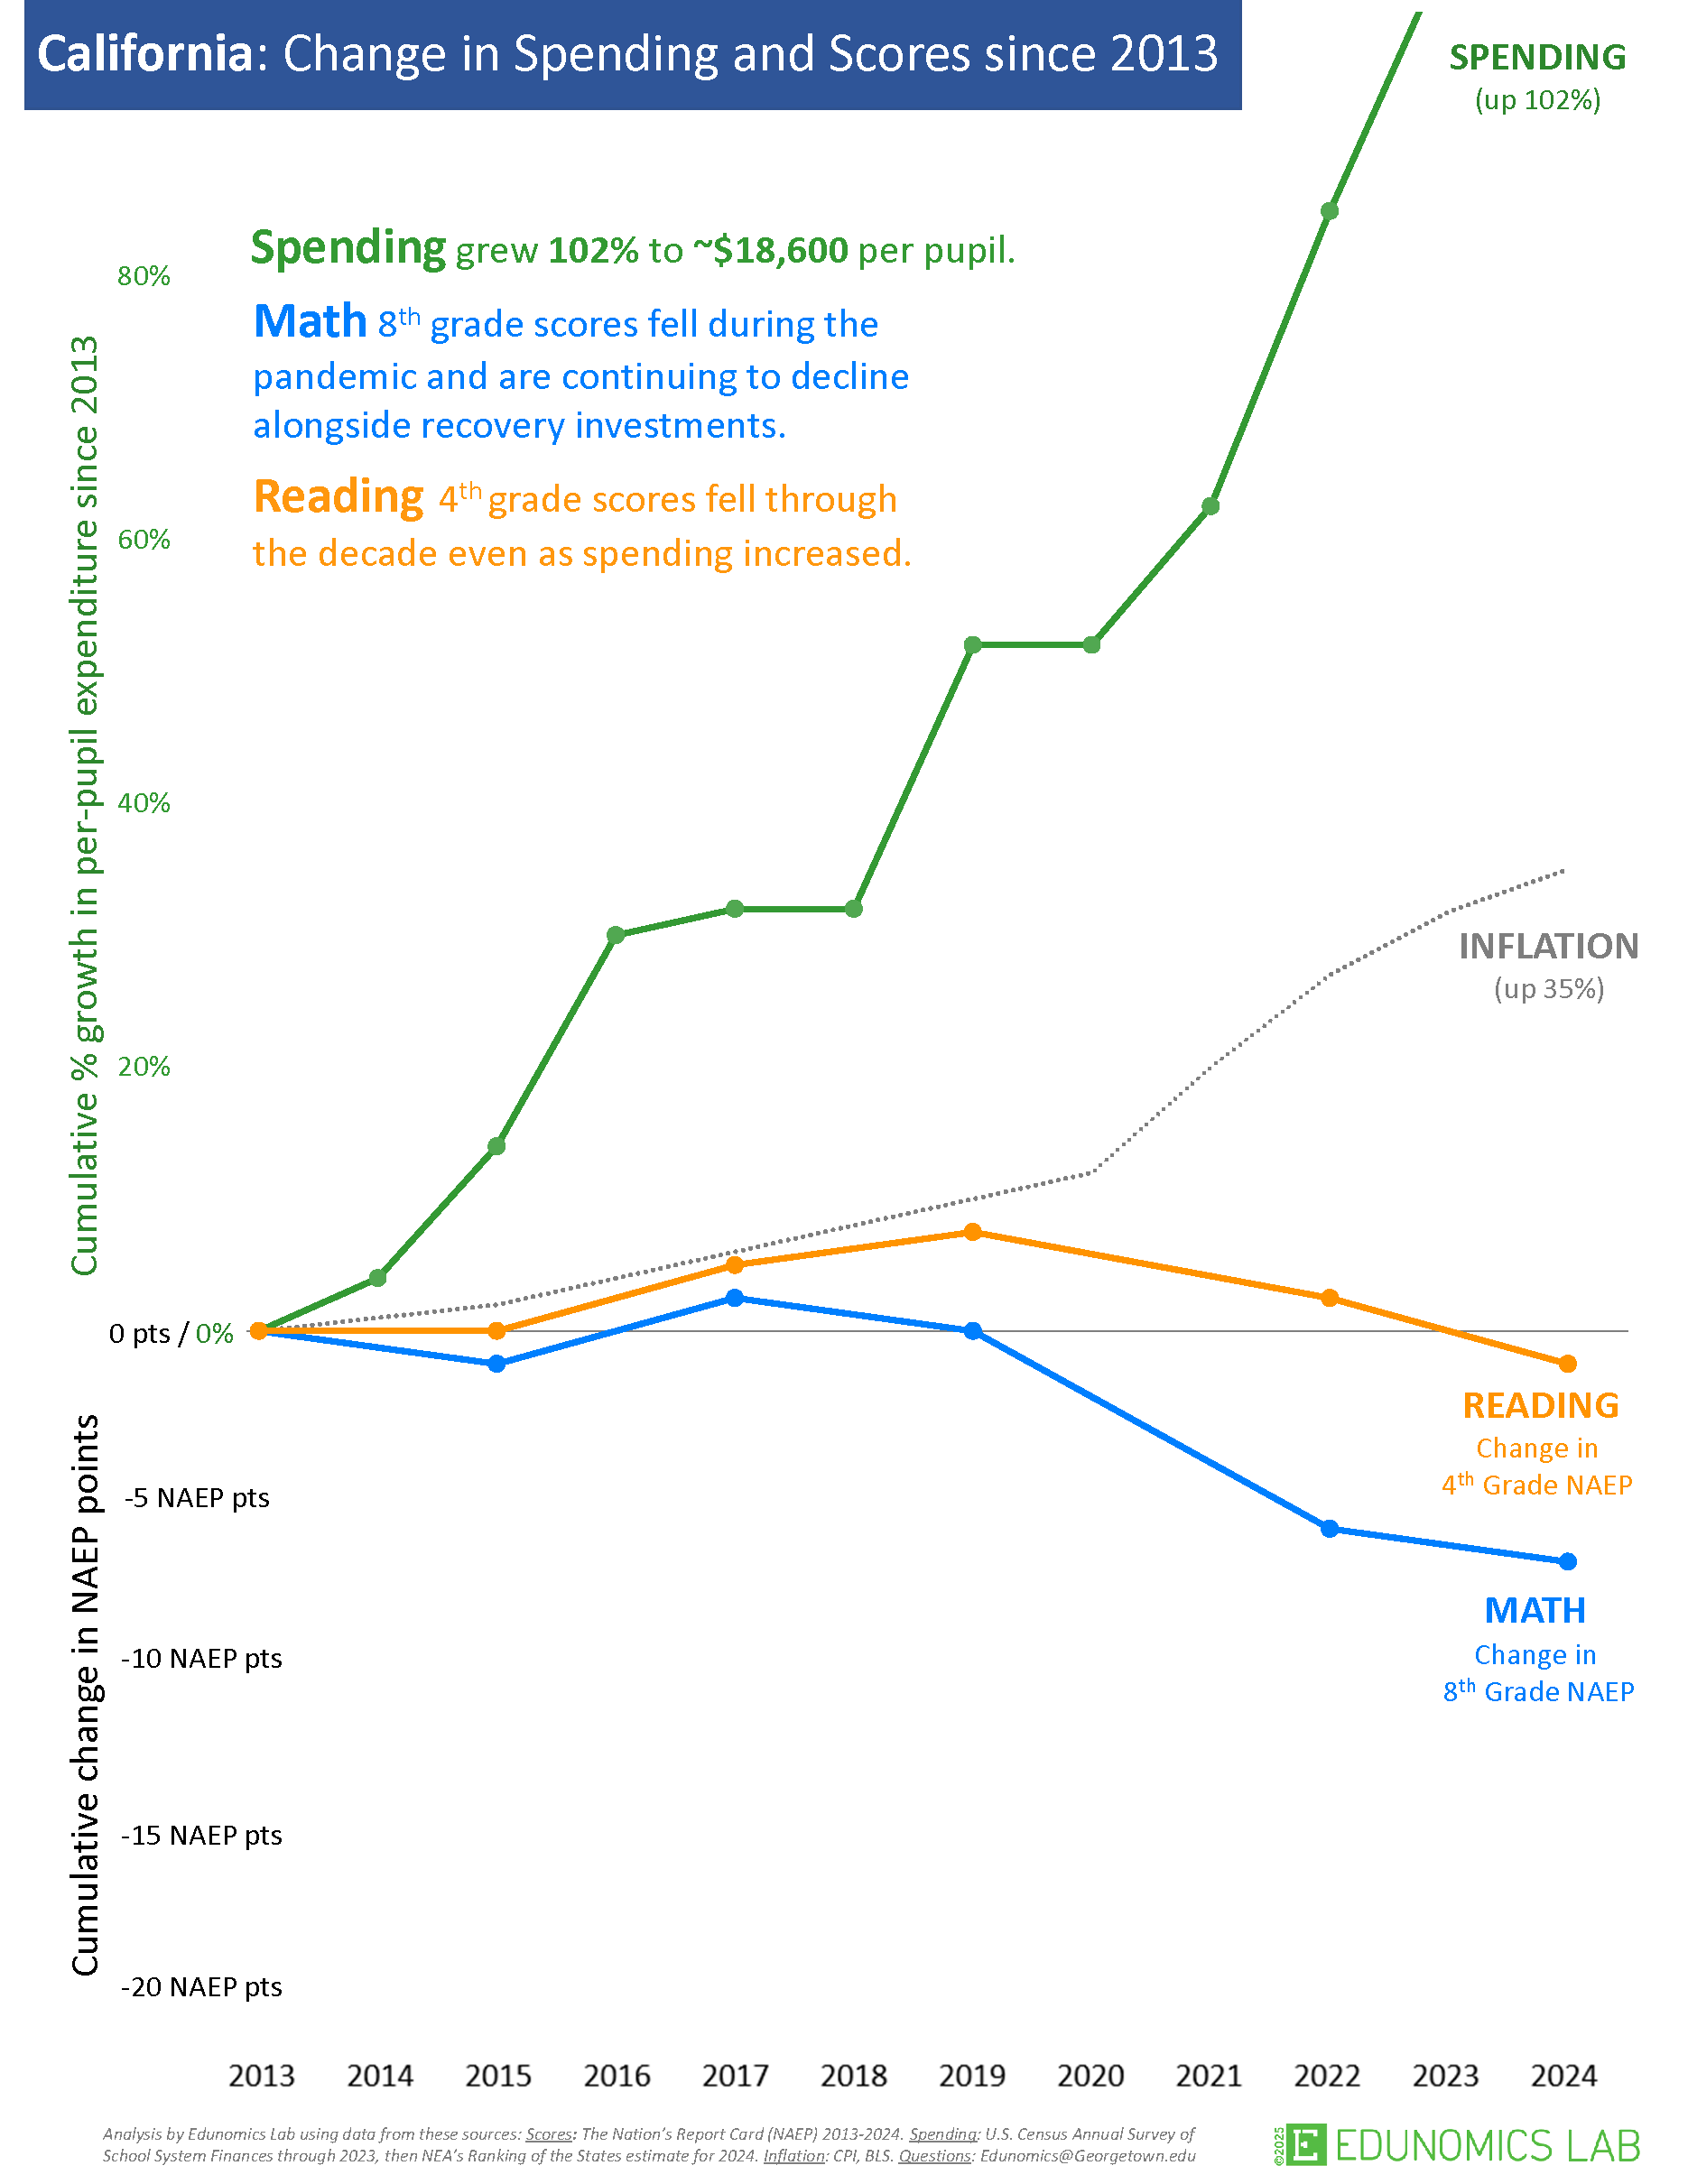
×
California2022-06-03T19:05:07+00:00

CALIFORNIA

The California Department of Education published FY 2019-20 school-by-school expenditure data on its LEA Accountability Report Card, known as the”LARC.” Explore California’s spending data below or jump over to the LARC HERE.

See our FY19 spending and outcomes analyses
Button: Links to NERD$ page

WHAT YOU CAN LEARN FROM THE REPORT CARD ABOUT SCHOOL-BY-SCHOOL SPENDING

The LARC does not have the capability to compare school financials with state and district averages.

Visit the LARC and search for your district, then select “Per-Pupil Expenditures” to see spending for all schools in that district.

The California LARC does not have the ability to directly compare spending with demographics.

I know which school(s) I want to compare.

Spending information is located on each district’s LARC. Demographics information must be obtained from each school’s SARC. Search for each of your comparison schools to compare demographics and spending data.

I do not know which schools I want to compare.

Visit California’s downloadable data files and select the files for your preferred metrics. Once you’ve identified your comparison schools search the LARC to collect spending information for comparison schools.

Due to the COVID-19 pandemic, limited outcomes data was collected for school year 2019-20. Visit each school’s report card to gather comparison details on spending, demographics, and any available outcomes data.

Edunomics Lab developed interactive data displays to explore resource equity, how dollars are allocated to schools, and which schools are most able to leverage their money to maximize student outcomes. Explore the analyses here.

If you have any questions about the data or feedback on the report card, email the SARC team.