Using Spending & Outcomes Data in Decision-Making
Closing schools: How much money does it save, and is it worth it?
In this commentary, Roza and Dhammani explore the math of school closures and outline data districts can consider in order to bring transparency to the process and ensure all students are served well.
Closures in Seattle Public Schools: A look at the data
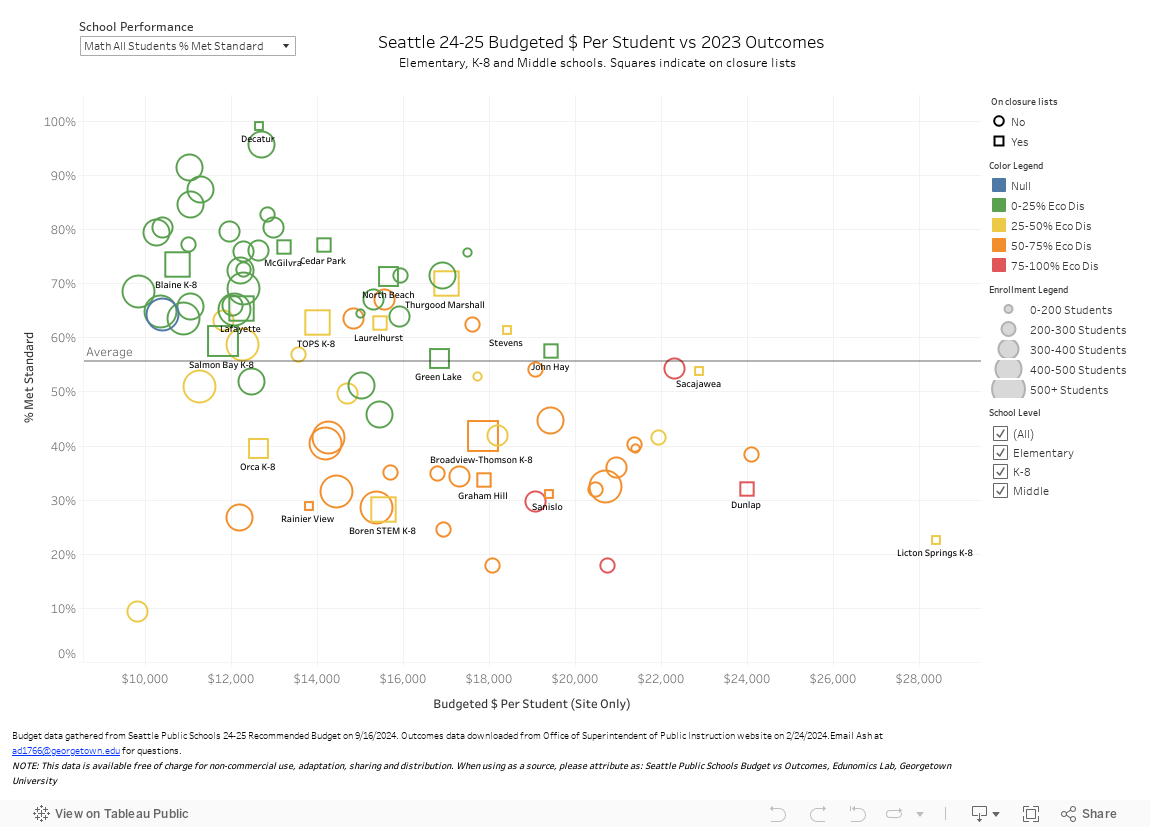
The scatterplot below compares Seattle Public Schools’ 24-25 budget data vs. ’23 student outcomes. Schools shown as squares and labeled are on one of the proposed closure lists. Leaders and the public can explore which schools are better able to leverage limited dollars to maximize outcomes for students.
Scatterplots for other districts/states
Interactive data displays allow users to explore these data for all schools in the country. The displays shed light on resource allocation patterns, how dollars are allocated to schools, and which schools are most able to leverage their money to maximize student outcomes. Use our tool to filter by specific districts, school characteristics, and student demographics for every state.