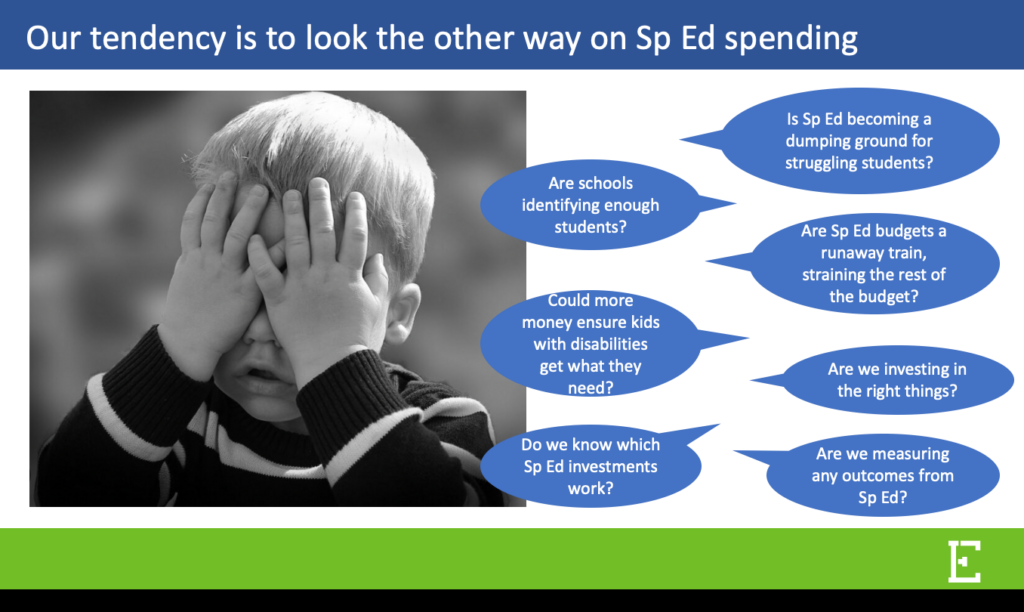
Special education spending is consuming a larger share of public school budgets
With new data emerging, Edunomics Lab is taking a fresh look at special education spending to better understand the extent to which rising identification rates and staffing increases deliver value for students.
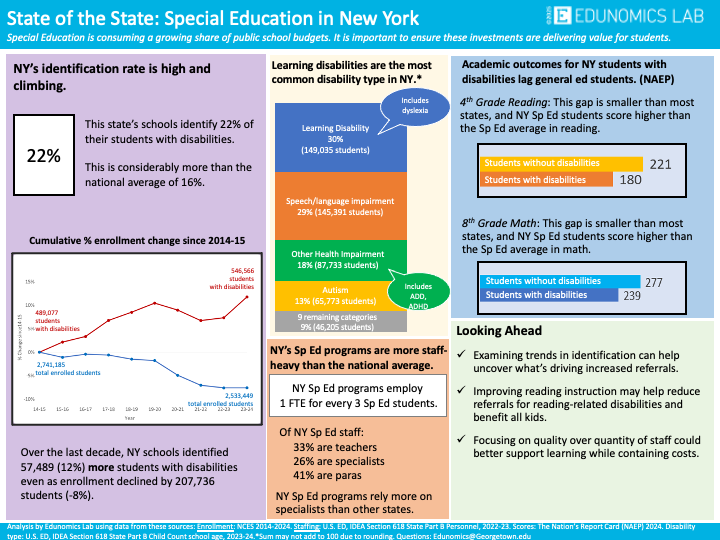
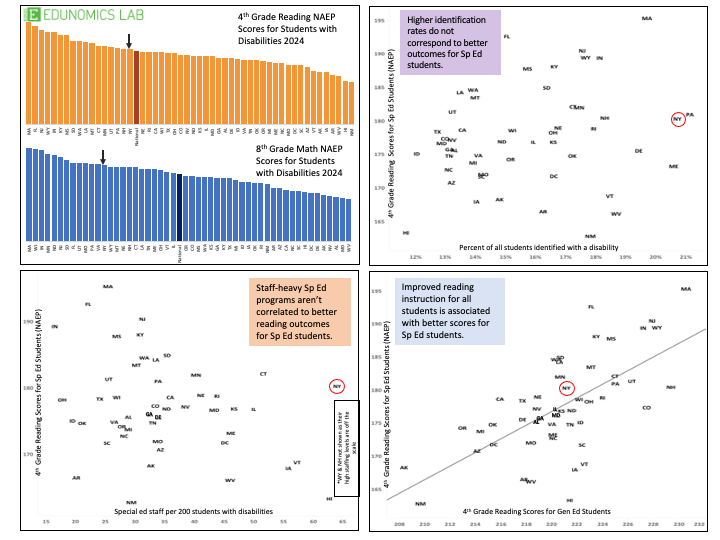
State-by-state comparisons make it clear that systems are making different choices when it comes to serving students with disabilities and those choices are delivering wildly different results for students.
How does the number of staff compare to the number of students in your state or district? How has that changed over time?
Connecticut
Massachusetts
Michigan
Pennsylvania
Texas
Washington
Graph trends for your state or district
STEP 1: Use our template to enter student enrollment and staffing data for your state or district, starting with the 2013-14 school year. We encourage users to use state or district published and audited data. Alternatively, data can be found on NCES Common Core of Data.
STEP 2: Download the custom graph showing staffing versus enrollment trends.