Calculator
Calculating Investments to Remedy Learning Loss
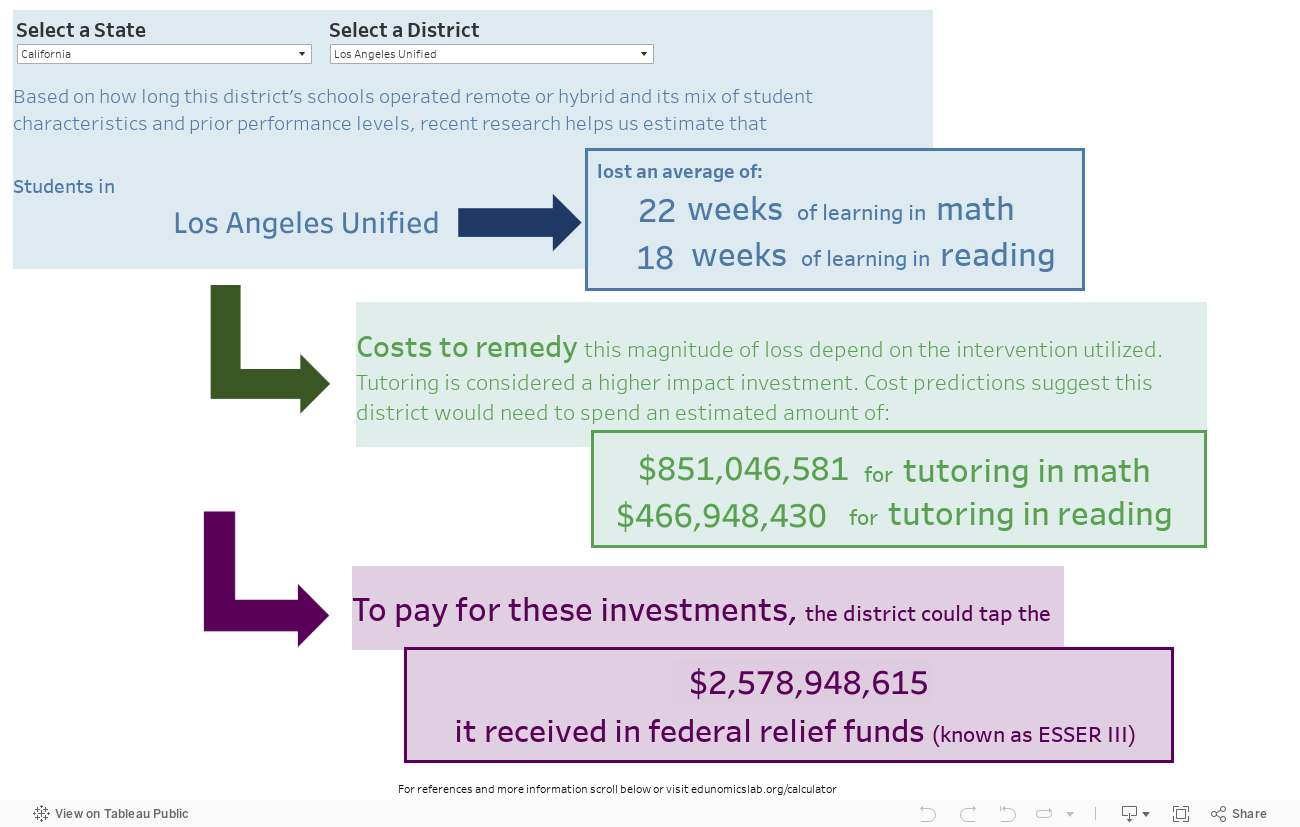
Pandemic-induced learning loss varies for numerous reasons, including how long a school operated in remote mode as well as student or school characteristics. ‘The Calculator” can help districts measure learning loss recovery costs, examine current recovery investments, and prioritize spending going forward to get student back on track.
Note: These figures represent predicted averages for each district’s mix of students, with higher losses in some schools and for some students, and lower in others based on learning time lost through the fall of 2021. They are estimates, and we encourage district leaders to quantify the actual student learning trends in their district, set against how much it would cost to address any student learning gaps. To understand how we made our projections, see our references below.
Looking for actual ESSER spending data district by district?
How can districts measure learning loss recovery costs? (30-minute webinar)
Questions: Please email edunomics@georgetown.edu.
References
Learning loss estimates by district were derived using the coefficients from Goldhaber et. al in The Consequences of Remote and Hybrid Instruction During the Pandemic.
Data for district instructional mode over the course of the 2020-21 school year comes from American Enterprise Institute’s Return to Learn Tracker (R2L).
The effect size estimates were converted to months of learning using NWEA 2020 MAP Growth Achievement Status and Growth Norms for Students and Schools.
Tutoring effect sizes come from The Impressive Effects of Tutoring on PreK-12 Learning: A Systematic Review and Meta-Analysis of the Experimental Evidence.
The estimates on the cost of tutoring programs comes from Were Federal COVID Relief Funds for Schools Enough? and Blueprint for Scaling Tutoring Across Public Schools.
District demographic data come from NCES and individual state demographic files.
Frequently Asked Questions
Why don’t I see my district listed?
The calculator relies on data inputs including the percentage of the 20-21 year spent remote or hybrid. Where we were unable to access that or other information, a district won’t be listed. Districts can also measure their actual student learning to assess the magnitude of their losses. Feel free to email our administrator for questions about any specific district.
Why is there a zero listed for my district’s federal relief allocation?
Not all districts received ESSER III allocations. Districts that did not receive an allocation would need to tap other district resources (E.g., annual operating budget) to pay for investments to reduce learning loss.
How come districts that operated 100% in person still have learning loss?
Losses were estimated for all districts, including those who operated in person for all of 2020-2021. Those losses may be attributed to remote operations in spring 2020, poor attendance during COVID outbreaks, increased use of substitutes, or other factors.
Why use tutoring to estimate costs of remedying learning loss?
Although there are many possible interventions our team used tutoring because research demonstrates larger effects on student learning of tutoring interventions (when compared to other interventions like class size reduction, etc.). That said, there is no research on remedying widespread losses of these magnitudes.
What are the costs if other interventions are used?
Because different interventions likely yield different magnitudes of effects on student learning, leaders should first estimate the quantity of those alternative interventions needed to meet the need (E.g., how much summer learning, etc.) Depending on those magnitudes, districts can then estimate their costs. Still, districts should continue to measure the effects of their interventions to assess whether they are having their intended impacts on student learning.
My district’s actual data show losses that are greater (or less severe) than estimated here.
The figures in the calculator are estimates based on research across districts using a standard set of variables. We recommend districts rely on their own actual data whenever possible.